Weekly Market Commentary
April 28th, 2025
Week in Review…
U.S. equities rose this week, with the S&P 500 and Nasdaq posting their second-best weeks of the year. Both indices recorded their second weekly gain in the past three weeks following the significant early April selloff. For the week ending, April 25, 2025:
- The S&P 500 rebounded, up 4.59%
- The Dow Jones Industrial Average increased by 2.48%
- The tech-heavy Nasdaq rallied by 6.73%
- The yield on the 10-Year Treasury dipped to 4.24% from last week’s reading of 4.34%, remaining below the long-term average of 5.84%
On Wednesday, the Institute for Supply Management (ISM) reported that the Manufacturing Purchasing Managers’ Index (PMI) for March 2025 was 49.5, indicating a slight contraction due to challenges in new orders and production. This follows marginal expansions in February and January after 26 months of contraction. Demand and output weakened, while input costs rose, negatively impacting economic growth. In contrast, the Services PMI showed strong growth with a reading of 56.3, driven by increased business activity.
On Thursday, durable goods orders saw a significant rise, particularly in the aerospace sector, though other areas remained subdued due to economic uncertainties stemming from tariffs. Friday’s final April Michigan Consumer Sentiment was revised upward from the initial print, reflecting better current and future expectations, although it remained at the lowest level since July 2022.
Spotlight

Market Liquidity: Some Drivers and Potential Paths Forward
In recent weeks, bond markets have experienced a significant decline in liquidity, accompanied by increased price volatility. Yields for fixed income securities across the board have risen, and yield curves have steepened. This repricing reflects a heightened risk aversion among investors, who are now demanding higher returns for lending money to various institutions, including governments, corporations, and households. Several factors contribute to this dynamic, with decreased market liquidity being a key one. While some effects may be temporary, others are likely to persist. The spotlight aims to explore both these aspects.
Current Market Conditions
Currently, market volatility is high, prompting investors to seek safer, cash-like investments. Large fixed income ETFs, which serve as proxies for corporate credit risk, have seen significant outflows, indicating that retail investors are selling in large numbers. The April tax season has also impacted market liquidity. The Treasury’s cash holdings at the Federal Reserve, known as the Treasury General Account (TGA), have increased substantially. From April 9 to April 24, the TGA grew by nearly $300 billion, representing tax receipts from corporations and households. This influx of funds acts as a drain on market liquidity. However, it is expected that much of this liquidity will return to the economy as the Treasury draws on its account to fund sizable government spending needs.
Yield Curve and Dollar Dynamics
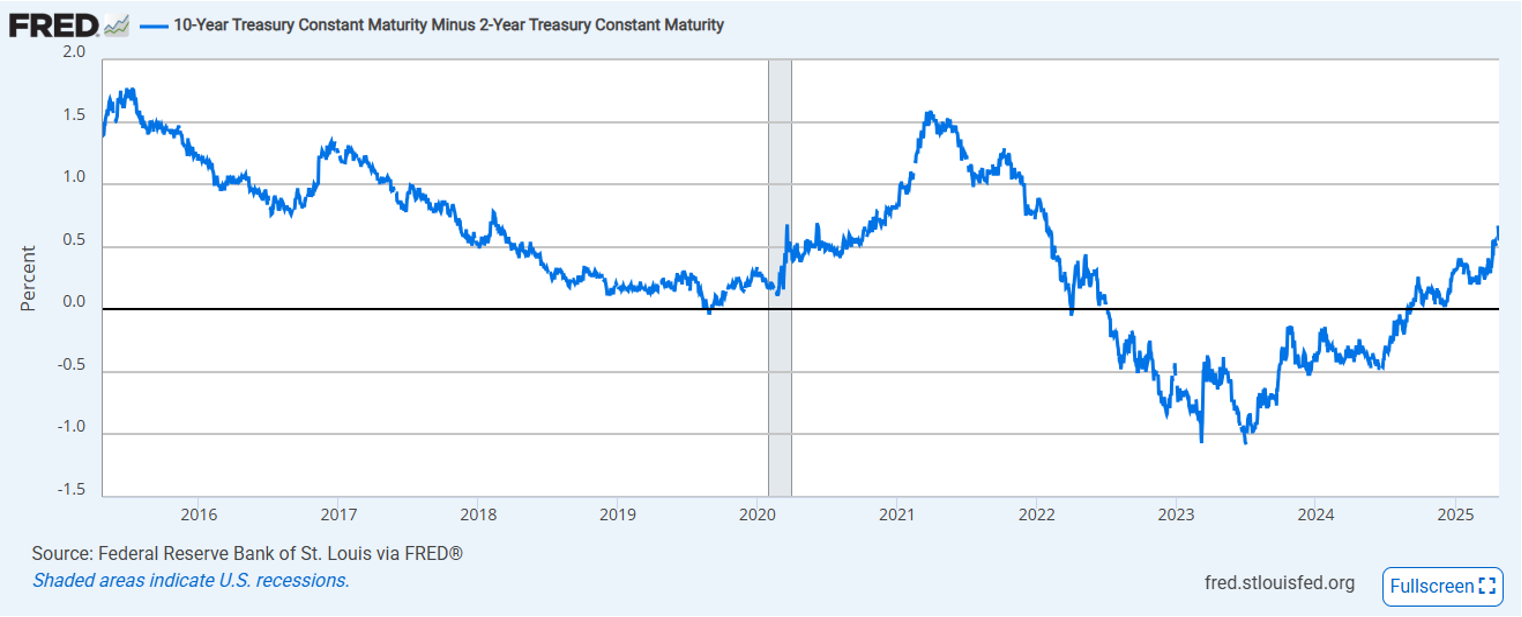
Long-term Treasury yields have risen relative to short-term yields, indicating that investors are demanding higher term premiums to lend money to the government. This steepening of the yield curve has coincided with a decline in the value of the dollar against major currencies, leading to speculation that foreign investors might be withdrawing capital from the U.S. However, evidence of this is mixed. The long-term difference between the 10-year and 2-year Treasury yields serves as a proxy for the term premium demanded by investors. As can be seen in the 10-2 spread, the term premium has been depressed (even negative) in recent years. Recently, this term premium has been returning to normal long-term levels, suggesting that the current yield curve movements are not unprecedented.
Source: Fred St. Louis
(click image to expand)
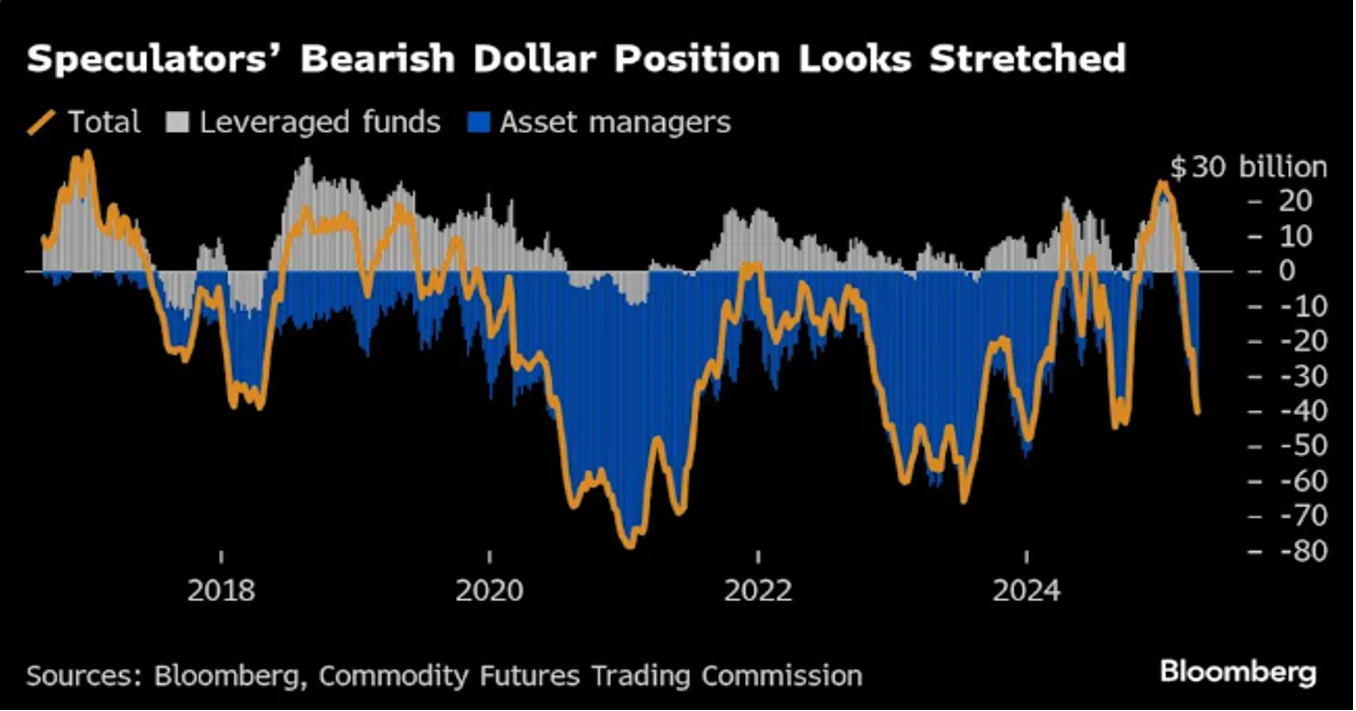
Investor positioning also plays a role in the dollar’s value. Being “short” on the dollar has become a consensus among investors, as shown in positioning charts. While changing inflation expectations could also affect the dollar, investor speculation and positioning are likely significant factors. If the yield curve and dollar positioning return to normalized levels, it could reassure markets that these effects are short-term rather than long-term shifts in demand for dollar-based assets.
Source: Bloomberg
(click image to expand)
The Basis Trade and Market Volatility
One source of recent volatility in bond markets is the so-called basis trade. This strategy exploits the liquidity differences between certain types of Treasuries and derivatives like Treasury futures. Investors buy cheaper Treasury securities and use them as collateral for short positions in Treasury futures, creating an arbitrage spread or “basis.” Hedge funds amplify this trade by borrowing money to purchase Treasury securities, maximizing returns. While this strategy is not inherently problematic, its current scale is concerning. Analysts estimate the trade’s notional size to be close to $800 billion, with some estimates even higher. Market volatility can lead to rapid unwinding of these positions, causing liquidity issues and market dysfunction. This was evident in March 2020 when the Federal Reserve had to intervene to stabilize Treasury markets. Recent volatility and liquidity erosion may be partly due to unwinding of the basis trade. Should this trade become a smaller percentage of the Treasury market overall, this could work to undo some of the recent effects we have observed (the opposite is true, as well).
While U.S. bond market liquidity may be structurally impaired, many short-term factors have contributed to recent conditions and are likely to subside in the coming months. These include retail investor sales, reduced Treasury cash balances post-tax season, and unwinding of bearish trades in the dollar and the basis trade. If these effects diminish and term premiums in Treasury markets return to historical norms, fixed income markets could rebound and contribute positively to diversified portfolios. However, the size of the basis trade remains a concern, as it could continue to be a source of volatility in Treasury markets.
Week Ahead…

Next week, key economic indicators will be released, offering insights into the U.S. economy. The ADP National Employment Report for April will provide a preview of private sector job growth ahead of the official employment report. The Job Openings and Labor Turnover Survey (JOLTS) report for March will detail job vacancies, hires, and separations, crucial for understanding labor market dynamics.
The GDP report for Q1 2025 will show economic activity, with a forecasted 0.4% change for the quarter. The Core Personal Consumption Expenditures (PCE) Price Index, the Fed’s preferred inflation measure, is expected to show a 0.1% change for March, down from 0.4% in February.
The Conference Board Consumer Confidence Index for April is expected to decline from 92.9 to 88.5, reflecting consumer sentiment. Additionally, pending home sales for March will indicate the health of the housing market and the ISM Manufacturing PMI will provide insights into the manufacturing sector’s performance.
This content was developed by Cambridge from sources believed to be reliable. This content is provided for informational purposes only and should not be construed or acted upon as individualized investment advice. It should not be considered a recommendation or solicitation. Information is subject to change. Any forward-looking statements are based on assumptions, may not materialize, and are subject to revision without notice. The information in this material is not intended as tax or legal advice.
Investing involves risk. Depending on the different types of investments there may be varying degrees of risk. Socially responsible investing does not guarantee any amount of success. Clients and prospective clients should be prepared to bear investment loss including loss of original principal. Indices mentioned are unmanaged and cannot be invested into directly. Past performance is not a guarantee of future results.
The Dow Jones Industrial Average (DJIA) is a price-weighted index composed of 30 widely traded blue-chip U.S. common stocks. The S&P 500 is a market-cap weighted index composed of the common stocks of 500 leading companies in leading industries of the U.S. economy. The NASDAQ Composite Index is a market-value weighted index of all common stocks listed on the NASDAQ stock exchange.
Securities offered through Cambridge Investment Research, Inc., a broker-dealer, member FINRA/SIPC, and investment advisory services offered through Cambridge Investment Research Advisors, Inc., a Registered Investment Adviser. Both are wholly-owned subsidiaries of Cambridge Investment Group, Inc. V.CIR.0425-1719


